

01 · Unit economicsUnit economics calculator
Looking at revenue per order and not at what is left after COGS, fulfilment, RTO and CAC.
You want to know whether one order really contributes, and the volume you need to break even.
Open the calculatorCalculators and a plain-English glossary for D2C marketing. No email wall, no gated PDF: put your numbers in and take the answer with you.


In short
MMC's free tools are calculators and a glossary that help a D2C brand work out what a customer can cost, where the funnel leaks, and how long profit takes. They cover unit economics, break-even ROAS, funnel ROAS, LTV:CAC and CAC runway. There is no email wall or sign-up, and your own numbers decide the answer.
There is no email wall and no sign-up. Put your numbers in and take the answer with you.

Each calculator is grouped by the question it helps you answer.
01 · Unit economicsLooking at revenue per order and not at what is left after COGS, fulfilment, RTO and CAC.
You want to know whether one order really contributes, and the volume you need to break even.
Open the calculator
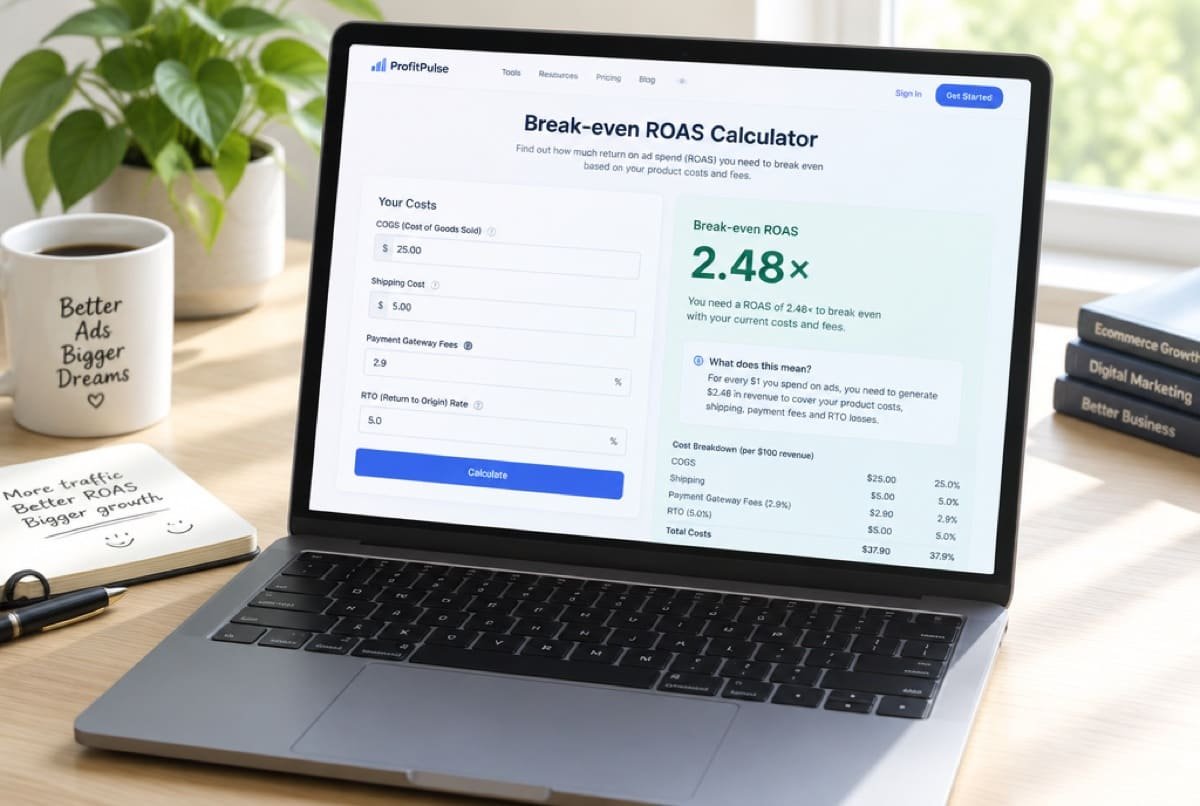
02 · Break-even ROASChasing a ROAS number you heard somewhere, instead of the one your own cost sheet gives.
You are setting or judging a ROAS target and want the exact break-even, and the one that hits your target margin.
Open the calculator
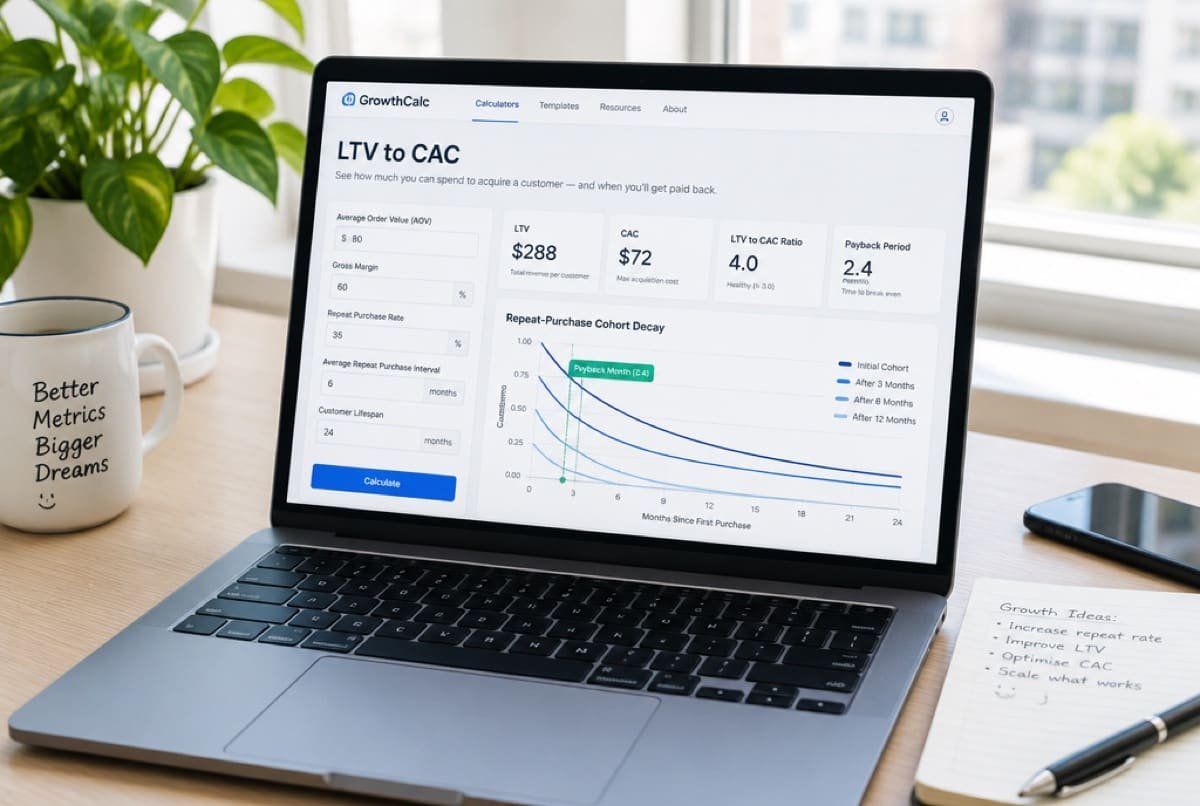
03 · LTV:CACJudging a customer by the first order alone.
You plan to keep customers and want to see the month your acquisition cost is paid back.
Open the calculator
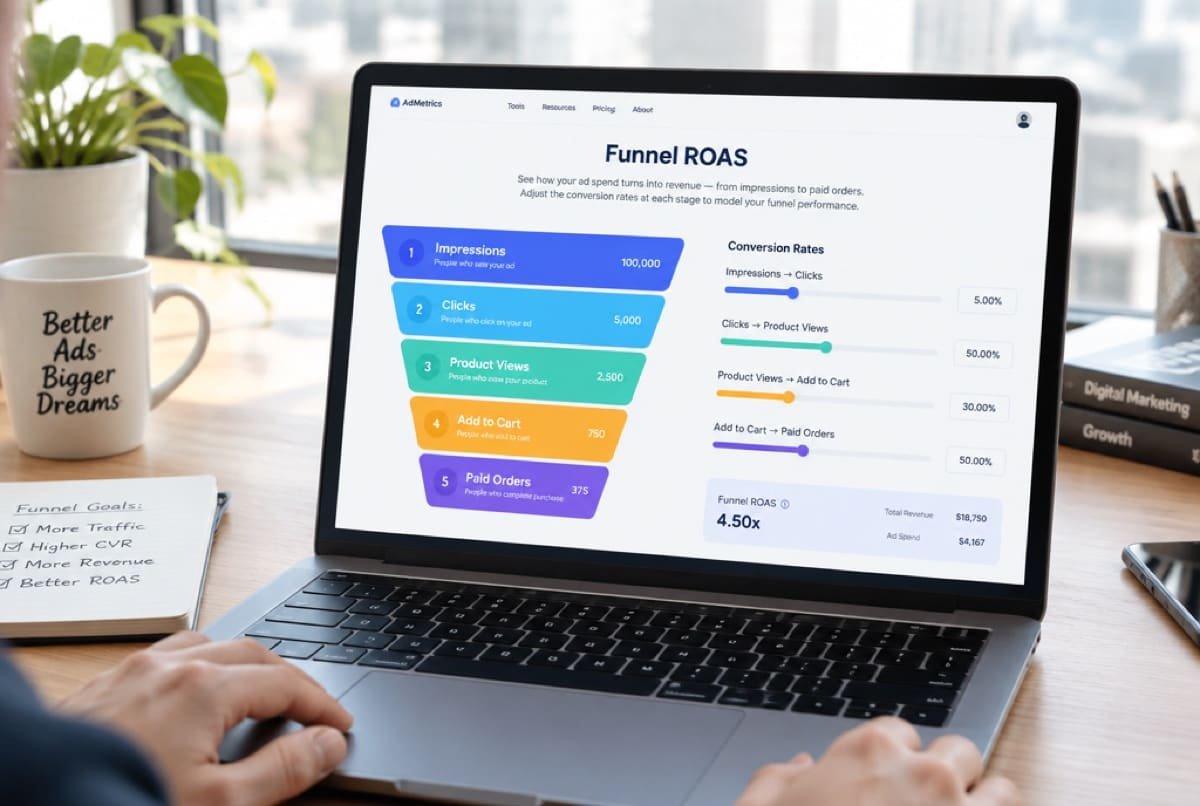
04 · Funnel ROASRaising spend to fix efficiency, when spend buys volume and not efficiency.
ROAS is low and you want to see which step between an impression and a paid order is leaking.
Open the calculator
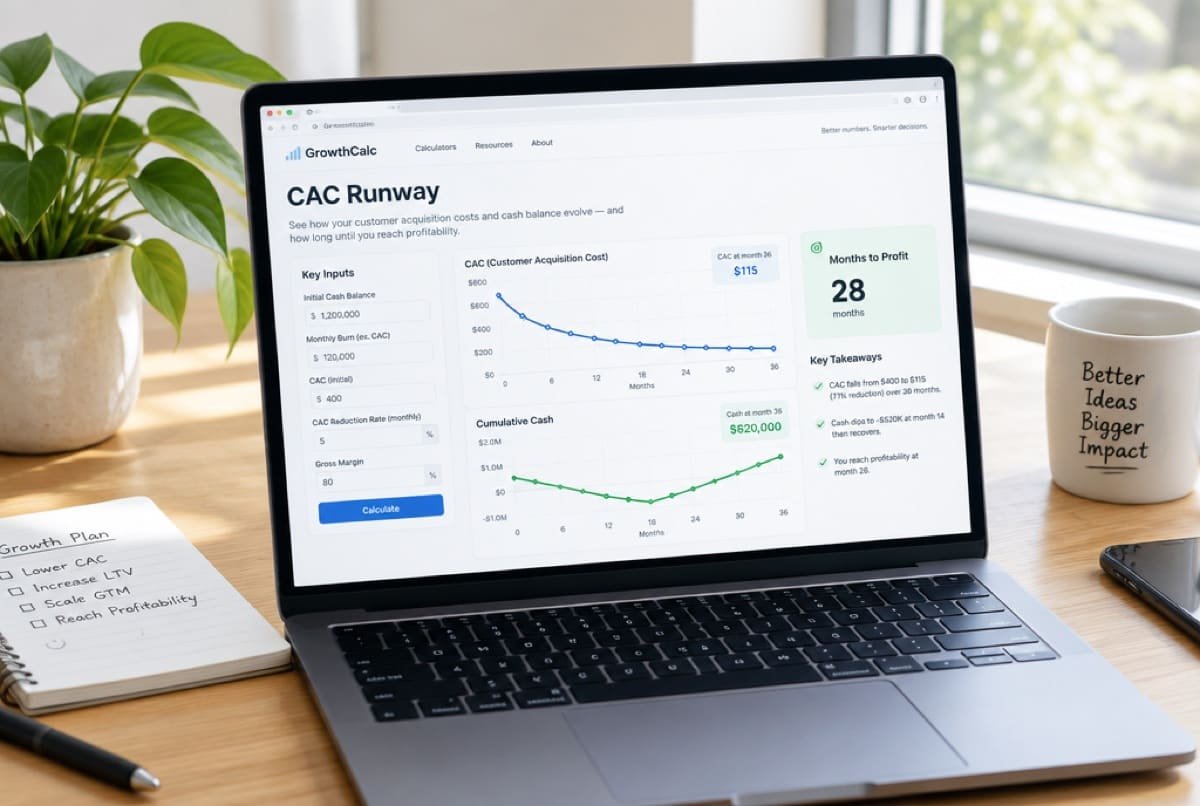
05 · CAC runwayExpecting a new brand to hit break-even CAC on day one.
You are launching or relaunching and need to know how long it takes to turn, and how much cash it burns.
Open the calculator
06 · Growth trajectoryHolding a year-one month-on-month growth rate for five years.
07 · GlossaryNodding along to ROAS, RTO or contribution margin without being sure what they mean.
Calculator screens shown here use example numbers, not real results.
Nothing here judges your brand. It shows the shape of the problem and the order worth fixing it in.

Start from your cost sheet and your ad account, not from a figure you heard elsewhere. Your break-even is specific to you.

Move one number, see what changes, then move the next. That shows which lever matters most.

RTO, shipping and gateway fees quietly reduce what an order leaves behind. Put them in before you trust a result.
Start with unit economics: if one order does not contribute, nothing downstream matters. Funnel ROAS then shows where efficiency is lost, break-even ROAS shows the efficiency you need, and LTV:CAC shows how patient you can afford to be. CAC runway answers how long a new brand burns before it turns, and growth trajectory projects the margin forward.

How to work out the ROAS your business needs before it makes money.
See Contribution margin and break-even ROAS
Attribution overlap between platforms, and how to read your real result.
See Why platform dashboards over-count
A simple way to test ads so the winner is not a coincidence.
See How D2C brands test creativeYes. There is no email wall and no gated download. You put your numbers in and see the answer.
Start with unit economics. If one order does not contribute, nothing downstream matters. Then use break-even ROAS for the efficiency you need and LTV:CAC for how patient you can be.
No. A number shows the shape of the problem and the order worth fixing it in. It does not judge your brand.
We can. Book a strategy call and bring the question that is stuck.
Next step
On a call, with a senior strategist. Bring your cost sheet and the question that is stuck. We plan the first 30 days.