What attribution overlap is
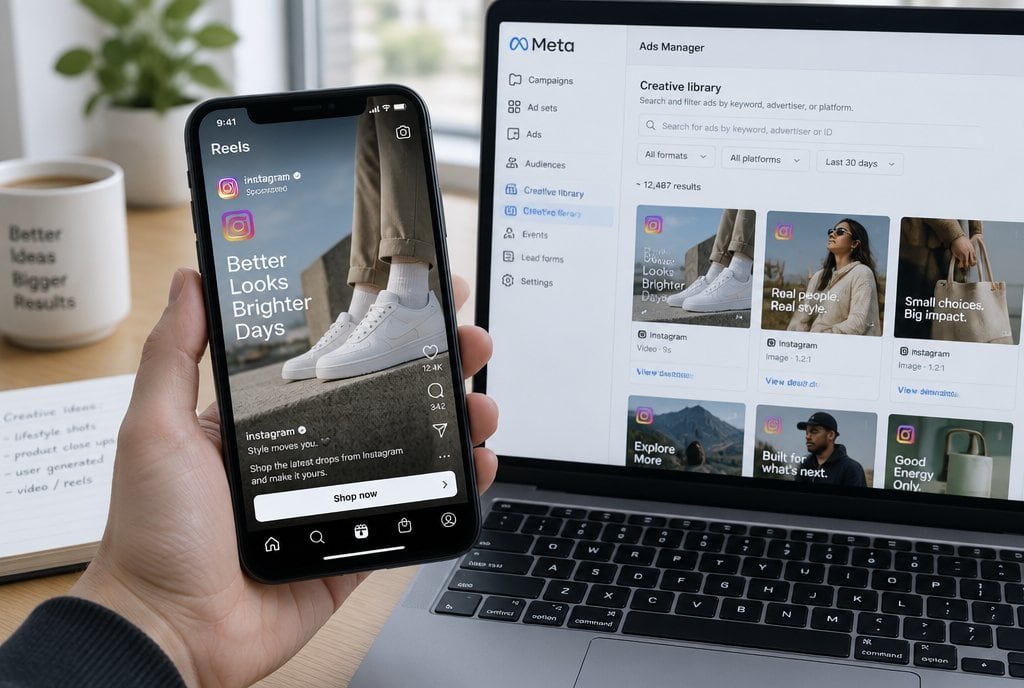
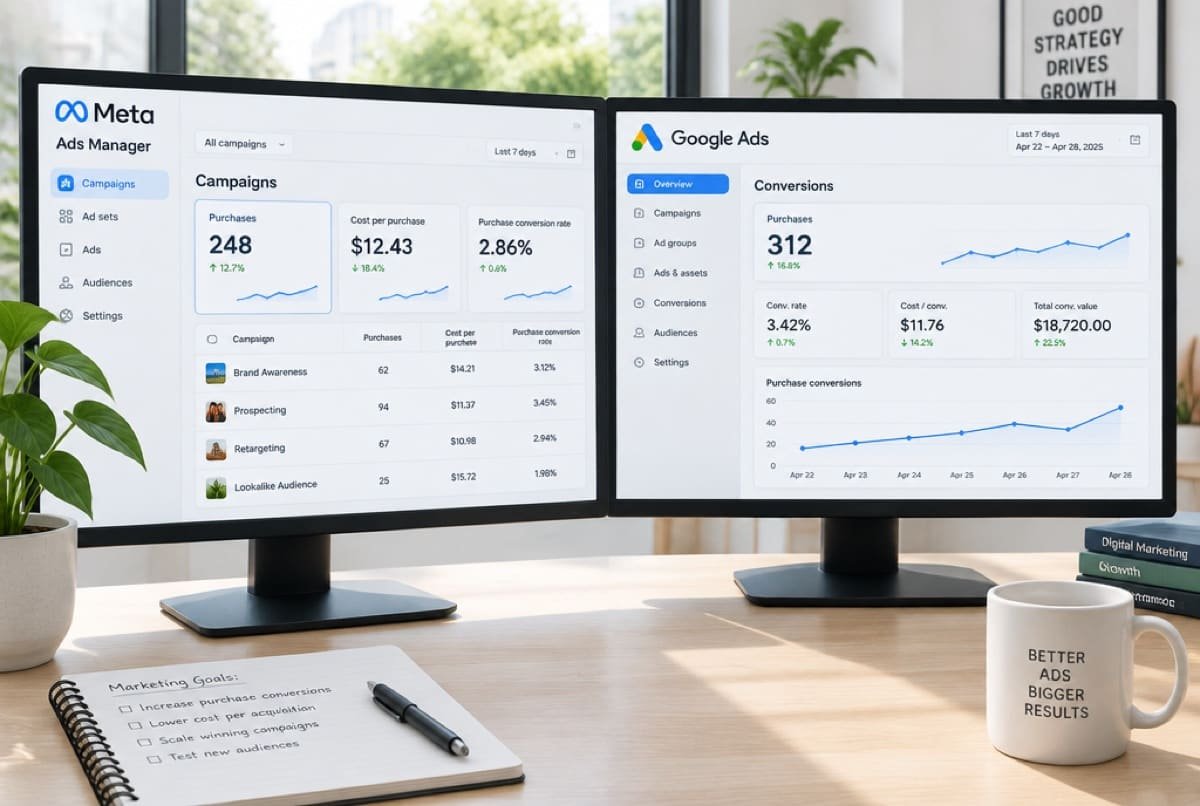
A customer often sees an Instagram ad, later searches on Google, and buys after clicking an email. Each platform can legitimately claim that sale under its own rules, so each one reports it. Put the three reports side by side and you count the same sale three times.
Nothing is broken when this happens. The platforms are each answering a different question: which of my ads did this person interact with?
An illustrative example
The numbers below are made up to show the pattern. Your own will differ.
| Source | Orders reported |
|---|---|
| Meta Ads Manager | 120 |
| Google Ads | 90 |
| Analytics tool | 140 |
| Store admin (real orders) | 150 |
| Sum of the three reports | 350 |
Illustrative example, not a benchmark
Why it happens
- Each platform uses its own attribution settings and its own way of counting a conversion.
- A person can touch several channels before buying, and more than one can claim the credit.
- Privacy settings, blocked cookies and app-to-web journeys mean each platform sees only part of the journey.
- Some reports count views as well as clicks, which widens what is credited to ads.
How to read your results anyway
- Start from store ordersYour store admin holds the real orders and revenue. Treat it as the base every other number is compared with.
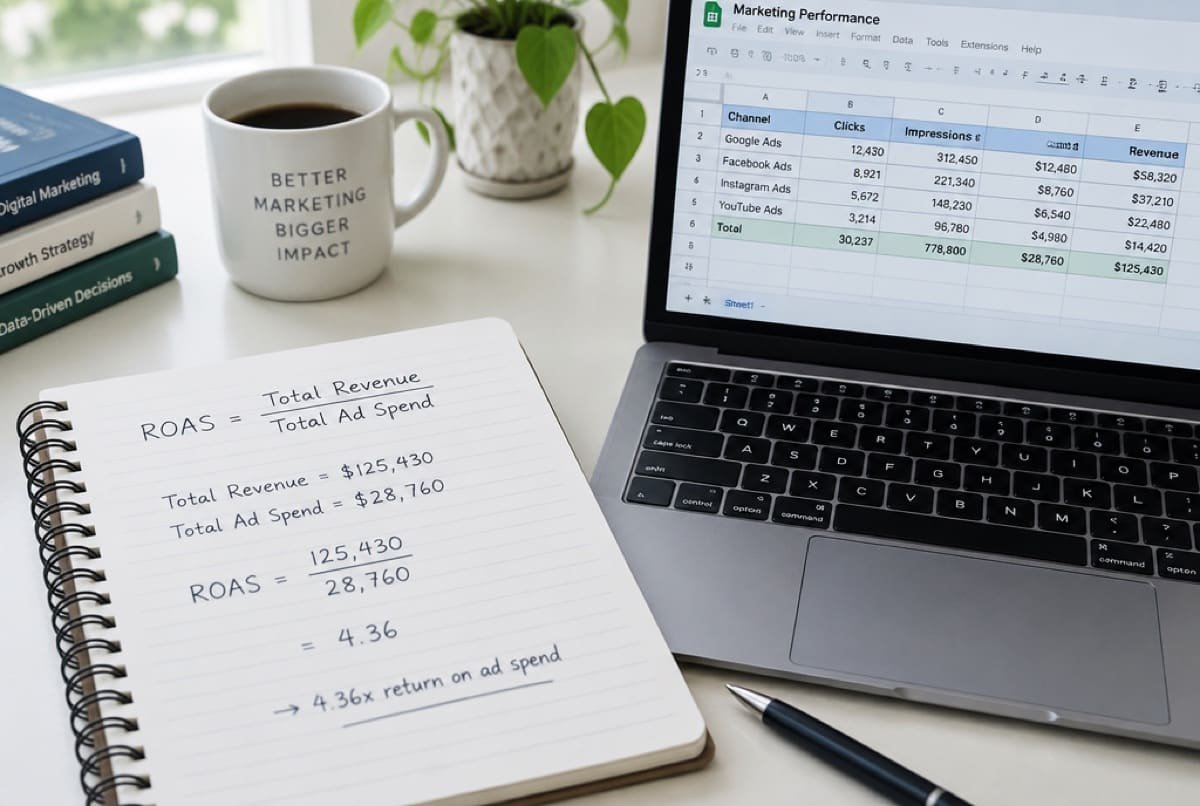
- Track blended ROASDivide total revenue by total ad spend across all channels. It ignores who claims credit, so it cannot double count.
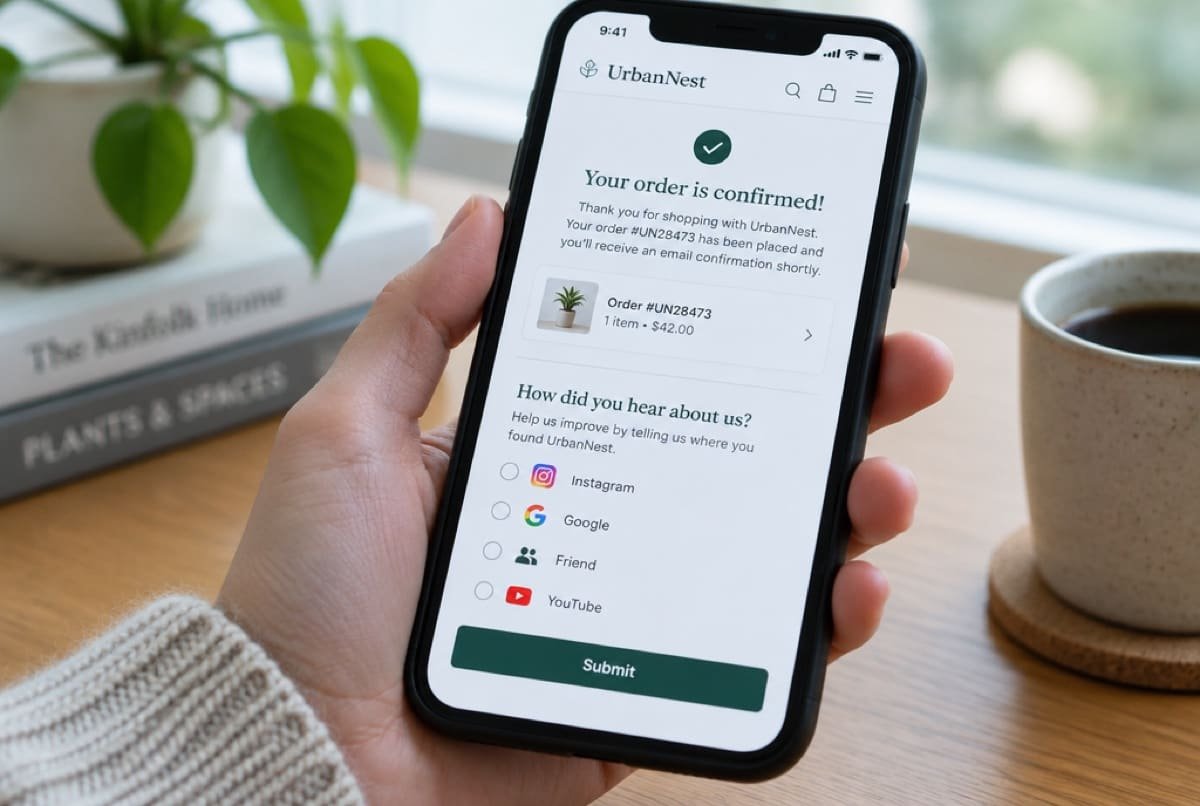
- Ask customersAdd a short 'How did you hear about us?' question after purchase. It catches channels that dashboards miss.
- Use platforms for directionWithin one platform, compare ads and audiences against each other. The comparison is useful even when the total is not exact.
- Test by switching offPause a channel for a planned period, or run a holdout, and watch total orders. The change shows what the channel really added.
Send the platforms better signals
Overlap is a measuring problem, and part of the fix is better data. Server-side tracking, such as the Meta Conversions API, sends purchase events from your server instead of relying only on the browser. That gives the platform a more complete view, which improves both reporting and the audiences it learns to find.
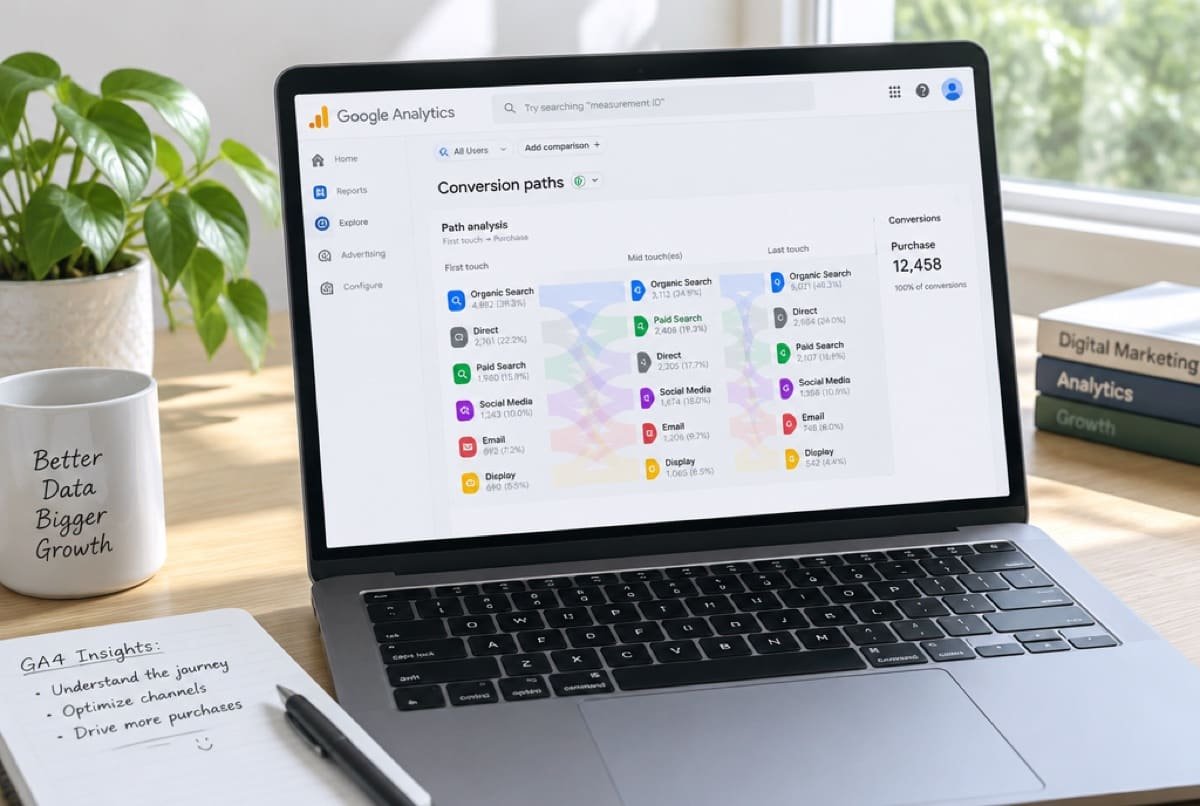
Clean event set-up in your analytics tool also helps you see the paths customers take before they buy.
Put it together
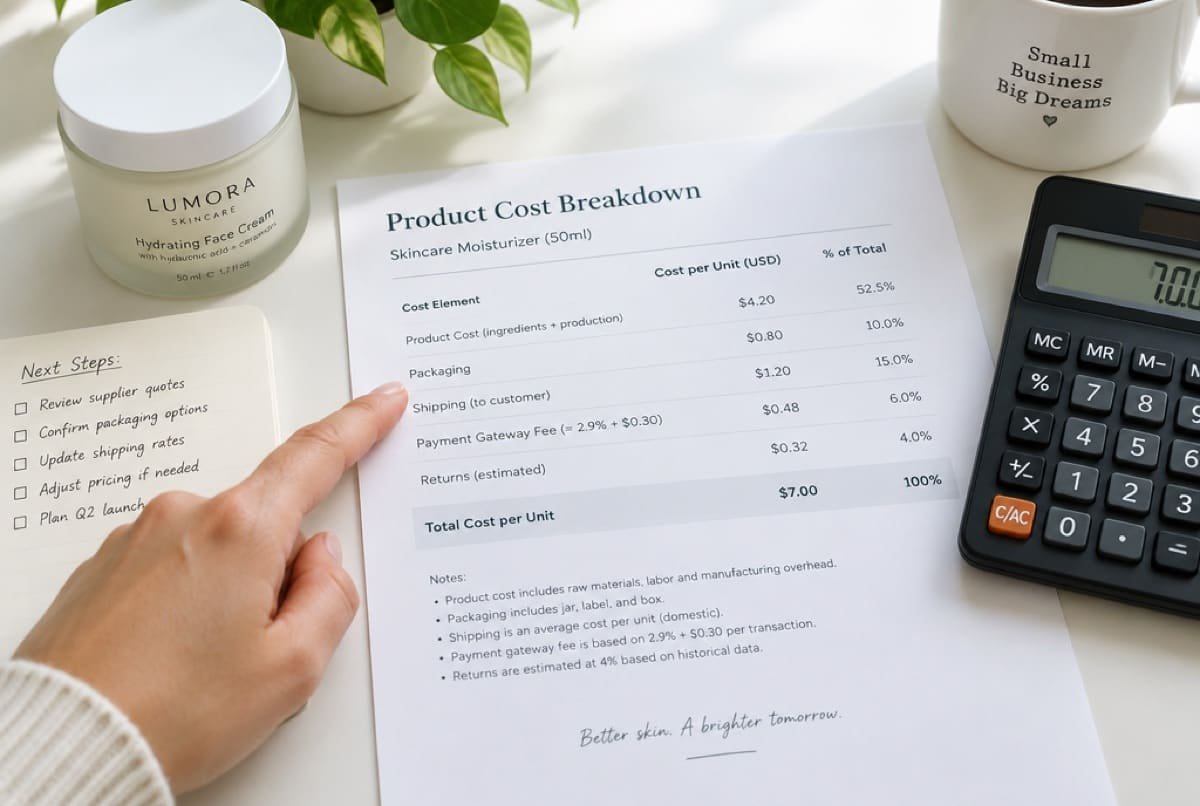
Track blended ROAS as the headline, use platform numbers to compare ads within a platform, and use surveys and switch-off tests to check the big spending decisions. Read all of it against your break-even ROAS, so the answer is whether the campaign makes money, not whether a dashboard looks good.