● Glossary

Every term we use,in plainEnglish.

53 terms from D2C and performance marketing: what each one means, how it is calculated, and why it matters to your P&L.

Run the numbers yourself
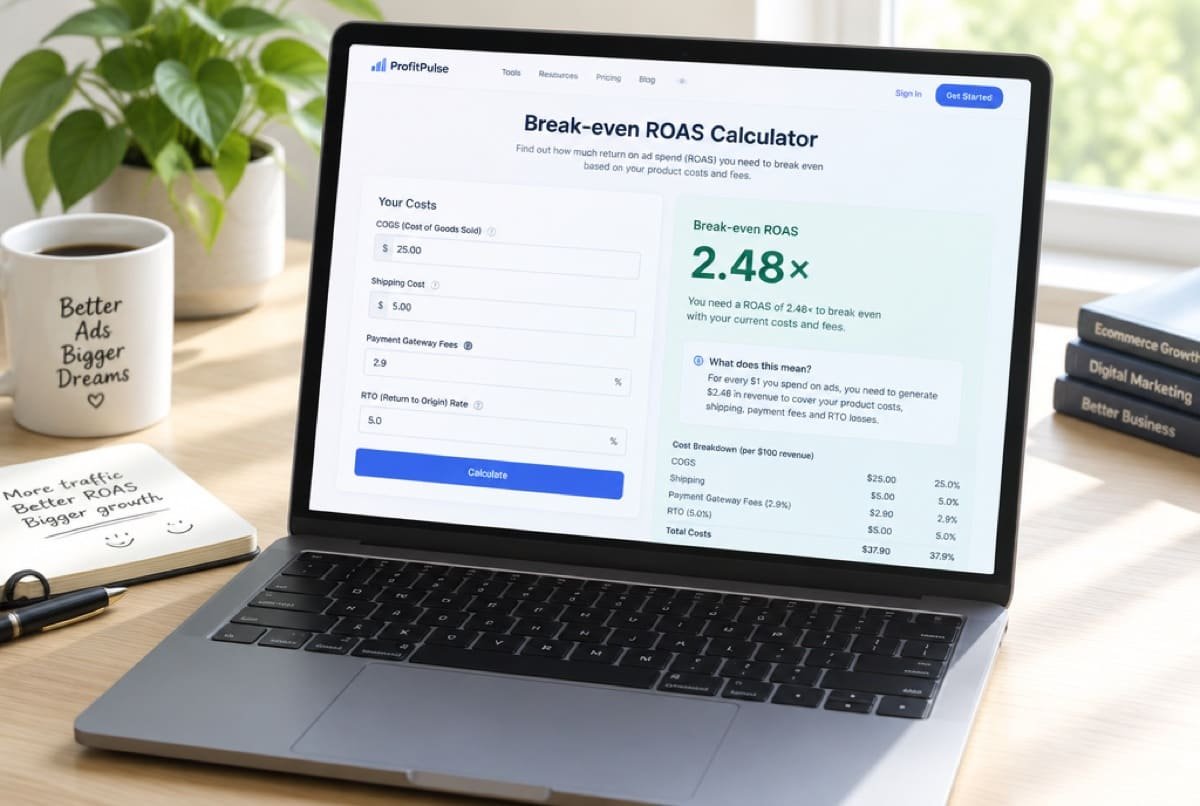
Break-even ROASThe ROAS you need
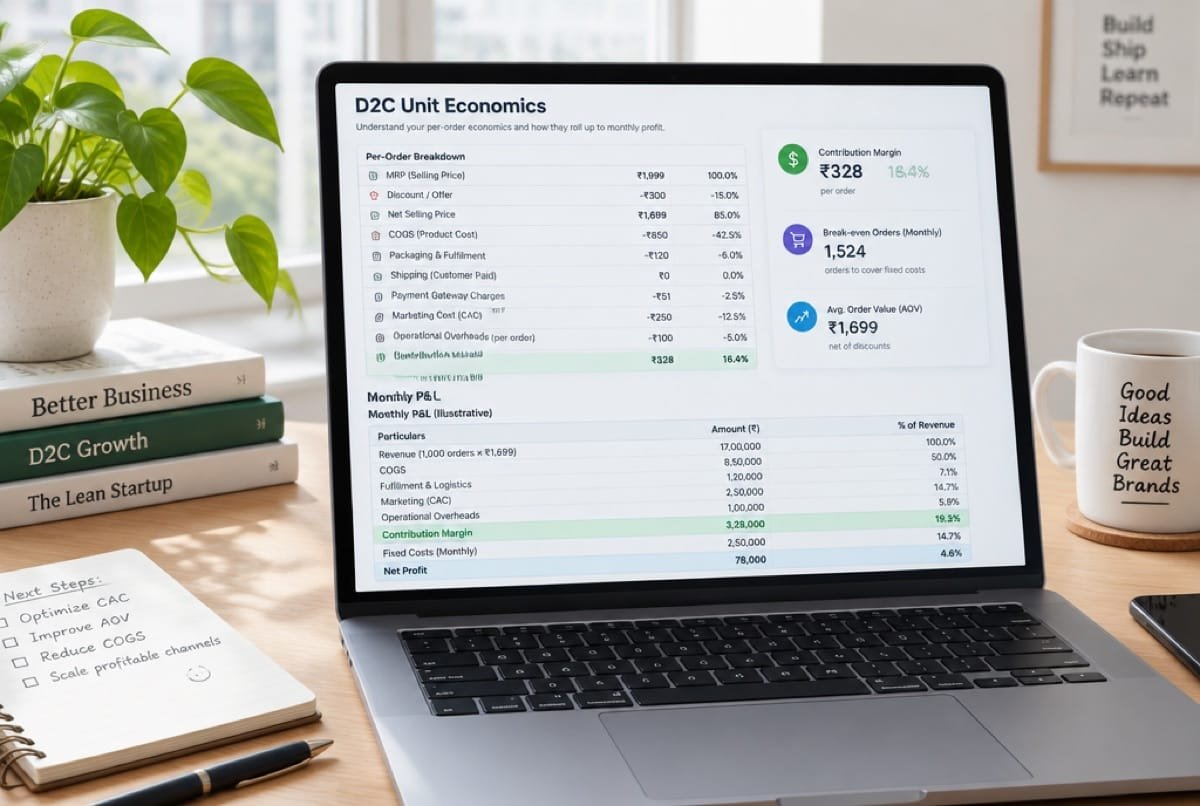
Unit economicsWhat one order leaves
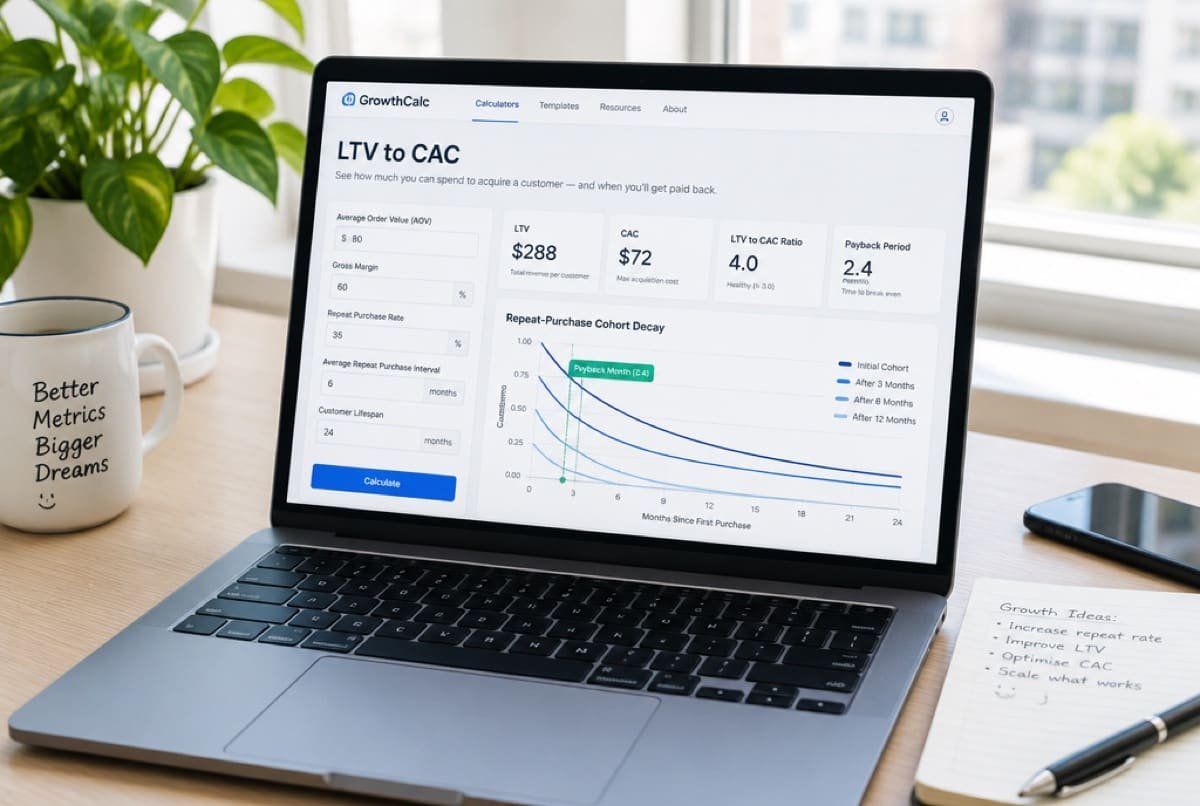
LTV:CACWhen you pay back
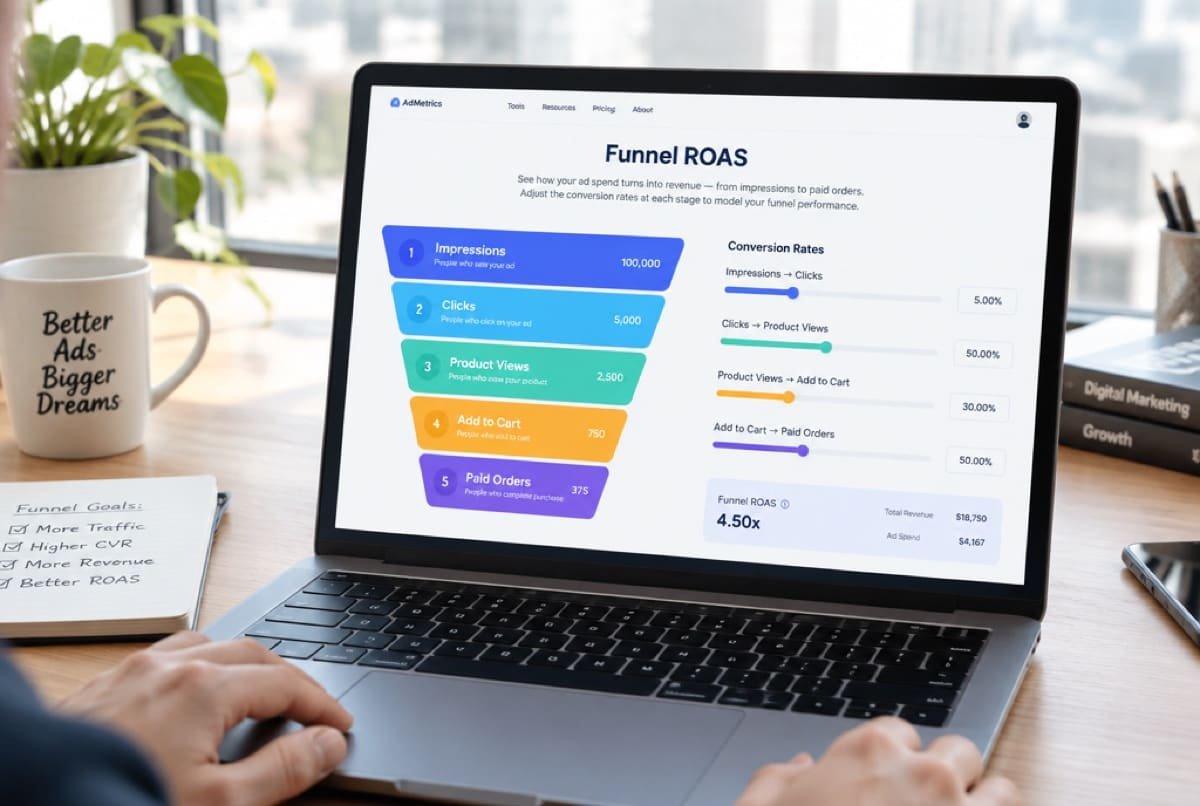
FunnelWhere it leaks

Showing all 53 terms

Money & margins

Average Order ValueAOV

The average rupee value of a single order. Total revenue divided by number of orders.

AOV = Revenue ÷ Orders

Why it mattersRaising AOV is often easier than lowering acquisition cost: a bundle or a free-shipping threshold can move it in a week.

Cost of Goods SoldCOGS

What the product itself costs you to make and land in your warehouse: materials, manufacturing, inbound freight, duties. Usually quoted as a percentage of selling price.

COGS % = Product cost ÷ Selling price × 100

Why it mattersIt sets the ceiling on everything. A brand at 55% COGS simply cannot buy customers as aggressively as one at 30%.

Contribution Margin

What's left from an order after every variable cost: product, shipping, payment fees and returns, but before marketing and salaries. It's the money actually available to buy the next customer.

Contribution = Revenue − COGS − Shipping − Fees − Returns

Why it mattersThis, not revenue, is the number that funds growth. Above 45% is comfortable; below 28% makes most paid channels unprofitable.

Net Margin

The percentage of revenue left as profit after absolutely everything, marketing included.

Net margin = (Contribution − Marketing) ÷ Revenue × 100

Why it mattersThe number your accountant cares about, and the one that decides whether growth is worth having.

Gross Merchandise ValueGMV

The total rupee value of everything sold before returns, discounts and fees are stripped out.

Why it mattersFlattering and widely quoted. Treat any GMV claim as a headline, not a result: net revenue is the honest version.

Acquisition & media

Return on Ad SpendROAS

How much revenue each rupee of ad spend produced. A 3× ROAS means ₹100 of ads returned ₹300 of revenue.

ROAS = Revenue ÷ Ad spend

Why it mattersIt says nothing about profit. A 3× ROAS is excellent for one cost structure and loss-making for another, which is why break-even ROAS exists.

Blended ROAS

Total revenue from all sources divided by total ad spend across all platforms, not the number any single ad platform reports.

Blended ROAS = Total revenue ÷ Total ad spend

Why it mattersPlatforms each claim credit for the same sale. Blended ROAS is the only version that reconciles with your bank account.

Break-even ROAS

The exact ROAS at which an order makes you neither profit nor loss. Below it you are paying for revenue.

Break-even ROAS = Revenue per order ÷ Contribution per order

Why it mattersYour real target, and it comes from your cost sheet, not from a benchmark someone quoted on LinkedIn.

Customer Acquisition CostCAC

What you pay in marketing to win one new customer.

CAC = Marketing spend ÷ New customers acquired

Why it mattersMeaningless on its own. It only means something next to contribution margin and repeat rate.

Cost Per MilleCPM

What it costs to show your ad one thousand times. 'Mille' is Latin for thousand.

CPM = Ad spend ÷ Impressions × 1,000

Why it mattersRises with competition and with narrow targeting. It sets how much attention your budget can buy at all.

Cost Per ClickCPC

What you pay for one click on your ad.

CPC = Ad spend ÷ Clicks

Why it mattersA blunt instrument: cheap clicks from the wrong audience cost more than expensive clicks from the right one.

Cost Per OrderCPO

Advertising cost divided by the number of orders it produced, including repeat buyers.

CPO = Ad spend ÷ Orders

Why it mattersClose cousin of CAC, but counts every order rather than only first-time customers.

Click-Through RateCTR

The share of people who clicked after seeing your ad.

CTR = Clicks ÷ Impressions × 100

Why it mattersThe clearest read on whether the creative earns attention. A weak hook shows up here before anywhere else.

Impressions

The number of times your ad was displayed. Not people: the same person seeing it three times is three impressions.

Why it mattersThe top of every funnel. Spend and CPM together decide how many you get.

Marketing Efficiency RatioMER

Total company revenue divided by total marketing spend: a whole-business view rather than a campaign one.

MER = Total revenue ÷ Total marketing spend

Why it mattersImmune to attribution arguments, because it never tries to assign credit to a channel.

Attribution

Deciding which ad or channel gets credit for a sale when a customer saw several before buying.

Why it mattersSince Apple's tracking changes, platform-reported attribution over-claims badly. Blended numbers and incrementality tests are the corrective.

Creative Fatigue

The decline in an ad's performance as the same audience sees it repeatedly.

Why it mattersUsually a symptom of a thin creative thesis rather than a thin budget: one idea in eleven costumes fatigues as fast as one ad.
Funnel & conversion

Conversion RateCVR

The share of visitors who complete the action you wanted: usually placing an order.

CVR = Orders ÷ Sessions × 100

Why it mattersDoubling conversion rate has exactly the same effect as doubling traffic, and costs far less.

Add to CartATC

A visitor putting an item in their basket. The first real signal of purchase intent.

Why it mattersThe landing-page-to-cart step is the most expensive one to get wrong, because you've already paid for every visitor by that point.

Conversion Rate OptimisationCRO

Systematically improving the share of visitors who buy: through page structure, offer, pricing, proof and checkout flow.

Why it mattersThe only growth lever that makes every other channel cheaper at the same time.

Checkout Abandonment

Shoppers who reach checkout and leave without paying.

Why it mattersIn India this is often about payment options and COD availability rather than price.

Landing PageLP

The page someone arrives on after clicking your ad.

Why it mattersIf fewer than 70% of clicks actually arrive, you have a speed or redirect fault: a technical problem wearing a marketing costume.

Bounce Rate

The share of visitors who leave without interacting at all.

Why it mattersHigh bounce on paid traffic usually means the ad promised something the page doesn't deliver.

Retention & lifetime

Lifetime ValueLTV

The total contribution one customer produces across every order they ever place, not their total spend.

LTV = Orders per customer × AOV × Contribution margin

Why it mattersBuild it on contribution, not revenue. Revenue-based LTV flatters the number and hides the fact that you're losing money.

LTV to CAC RatioLTV:CAC

How many rupees of lifetime contribution you get for every rupee spent acquiring the customer.

LTV : CAC = LTV ÷ CAC

Why it matters3:1 is the standard benchmark. Below 2:1 growth burns cash; far above 4:1 usually means you're underspending.

CAC Payback Period

How long it takes for a customer's cumulative contribution to repay what you spent acquiring them.

Why it mattersGoverns how fast you can grow without outside money. Three-month payback recycles your cash four times a year; twelve-month payback, once.

Repeat Purchase Rate

The share of customers who buy again within a given period.

Why it mattersThe cheapest growth available to most brands. It needs no extra ad spend at all.

Purchase Cycle

The typical gap between one order and a customer's next. A supplement might be 30 days; a jacket, a year.

Why it mattersSets the clock on retention. Chasing a repeat purchase before the cycle is up mostly buys discounts you didn't need to give.

Cohort

A group of customers who first bought in the same period, tracked together over time.

Why it mattersThe only honest way to see whether retention is improving: blended averages hide a declining trend behind new-customer growth.

Churn

The share of customers who stop buying over a given period.

Why it mattersThe mirror image of repeat rate, and the quiet reason many brands need ever-increasing ad budgets to stand still.

RFMRFM

Recency, Frequency, Monetary value: a way of segmenting customers by how recently they bought, how often, and how much they spend.

Why it mattersThe backbone of most lifecycle and CRM segmentation.

Commerce & fulfilment

Direct to ConsumerD2C

Selling straight to the customer from your own store, rather than through a retailer or distributor.

Why it mattersYou keep the margin and, more importantly, the customer relationship and the data.

Return to OriginRTO

An order that ships out, fails to be delivered or is refused, and comes back to you. Overwhelmingly a cash-on-delivery problem.

Why it mattersA returned order earns nothing but still pays shipping in both directions. At 25% RTO you lose a quarter of revenue while paying more than your full forward shipping cost.

Cash on DeliveryCOD

The customer pays the courier in cash when the parcel arrives, rather than paying online up front.

Why it mattersStill a large share of Indian e-commerce. It lifts conversion and raises RTO at the same time: the trade-off has to be modelled, not assumed.

Prepaid Ratio

The share of orders paid online before dispatch, as opposed to COD.

Why it mattersThe single most effective lever on RTO. A small prepaid discount often pays for itself several times over.

Payment Gateway Fee

The cut a payment processor takes on each online transaction, typically around 2% in India.

Why it mattersSmall per order, but it comes straight out of contribution and is easy to forget in a margin model.

Marketplace Commission

The percentage Amazon, Flipkart, Myntra, Nykaa and similar platforms take from each sale.

Why it mattersIt rents you demand and keeps the customer relationship. Works until the category crowds or the rate changes.

Quick CommerceQ-commerce

Ten-to-thirty-minute delivery platforms: Blinkit, Zepto, Instamart, Flipkart Minutes.

Why it mattersA different game from marketplace: limited assortment, dark-store availability, and visibility measured in minutes rather than days.

Fulfilment Cost

Everything it takes to get an order to the door: pick, pack, packaging materials and courier charges.

Why it mattersOften understated in margin models because packaging and handling get left out of the shipping line.

Contribution ladder

Contribution Margin 1CM1

What's left of net revenue after the product itself: raw material, packaging, labour, inbound freight. The first rung of the ladder.

CM1 = Net revenue − COGS

Why it mattersIf CM1 is thin, nothing downstream can rescue the order. It's a sourcing and pricing problem, not a marketing one.

Contribution Margin 2CM2

CM1 minus the cost of getting the order to the customer's door: shipping, payment gateway, packing and warehousing.

CM2 = CM1 − Fulfilment costs

Why it mattersThe gap between CM1 and CM2 is where free-shipping promises quietly go to die.

Contribution Margin 3CM3

CM2 minus returns and the cost of acquiring the customer. The true per-order contribution: the only one that pays for salaries, rent and profit.

CM3 = CM2 − RTO cost − RTO-adjusted CAC

Why it mattersIf CM3 is negative, every additional order makes the loss bigger. Volume never fixes a broken CM3.

Fixed Overhead

Monthly costs that don't move with order volume: salaries, rent, software, retainers.

Why it mattersContribution has to clear this before a single rupee is profit. It sets your break-even volume.

Break-even Units

The number of orders a month at which total contribution exactly covers fixed costs.

Break-even units = (Fixed overhead + D&A) ÷ CM3

Why it mattersThe clearest target a founder can hold. Below it you're funding the business; above it, it funds you.

P&L lines

Earnings Before Interest, Tax, Depreciation & AmortisationEBITDA

Operating profit before financing costs, tax and non-cash charges. A rough proxy for cash generated by the business itself.

EBITDA = Total contribution − Fixed overhead

Why it mattersThe number most investors anchor on, because it strips out how the business is financed and taxed.

Earnings Before Interest & TaxEBIT

EBITDA after depreciation and amortisation. Also called operating profit.

EBIT = EBITDA − Depreciation & amortisation

Why it mattersCloser to economic reality than EBITDA, because equipment and tooling genuinely do wear out.

Profit After TaxPAT

What the business actually keeps once everything is paid: costs, depreciation and tax. Also called net profit.

PAT = EBIT − Tax

Why it mattersThe bottom line in the literal sense. Everything above it is an argument; this is the result.

Depreciation & AmortisationD&A

The spread-out cost of assets you already paid for: moulds, machinery, tooling and software, charged a bit each month.

Why it mattersNo cash leaves the bank in the month it's charged, which is why EBITDA and EBIT can differ so much.

Maximum Retail PriceMRP

The printed price including GST: the number on the pack, before any discount.

Why it mattersYour working figure is never MRP. Strip the discount, then strip GST, and what remains is net realised revenue.

Goods & Services TaxGST

Indian indirect tax included in the price the customer pays. It's collected on the government's behalf, never yours.

Net revenue = Selling price ÷ (1 + GST rate)

Why it mattersModelling margin on the GST-inclusive price overstates revenue by the full tax rate: 18% of imaginary money.

Growth

Month-on-Month GrowthMoM

How much a figure grew against the previous month.

MoM % = (This month ÷ Last month − 1) × 100

Why it mattersIt compounds, which is why it's deceptive in both directions. 10% a month is 214% a year; a 3% monthly decline halves you inside two years.

Year-on-Year GrowthYoY

A period compared against the same period twelve months earlier.

YoY % = (This year ÷ Last year − 1) × 100

Why it mattersThe honest comparison for a seasonal business, because it holds the season constant.

Run Rate

The current month's revenue projected forward as if it held for twelve months.

Annual run rate = Latest month × 12

Why it mattersUseful shorthand, easy to abuse. A run rate quoted off a festive-season month is a marketing claim, not a forecast.

Next step

Still unsure which number is your problem?

On a call, with a senior strategist. We find the number that matters for your brand and show what to do about it.

How the audit works
WhatsApp